Infographics
A picture is worth a thousand words
Our Creative and Communication team will use plain language and design to make your technical sustainability information easy for your stakeholders, including customers, suppliers and team, to read, understand and act on.
Decarbonisation Roadmap - Concrete NZ
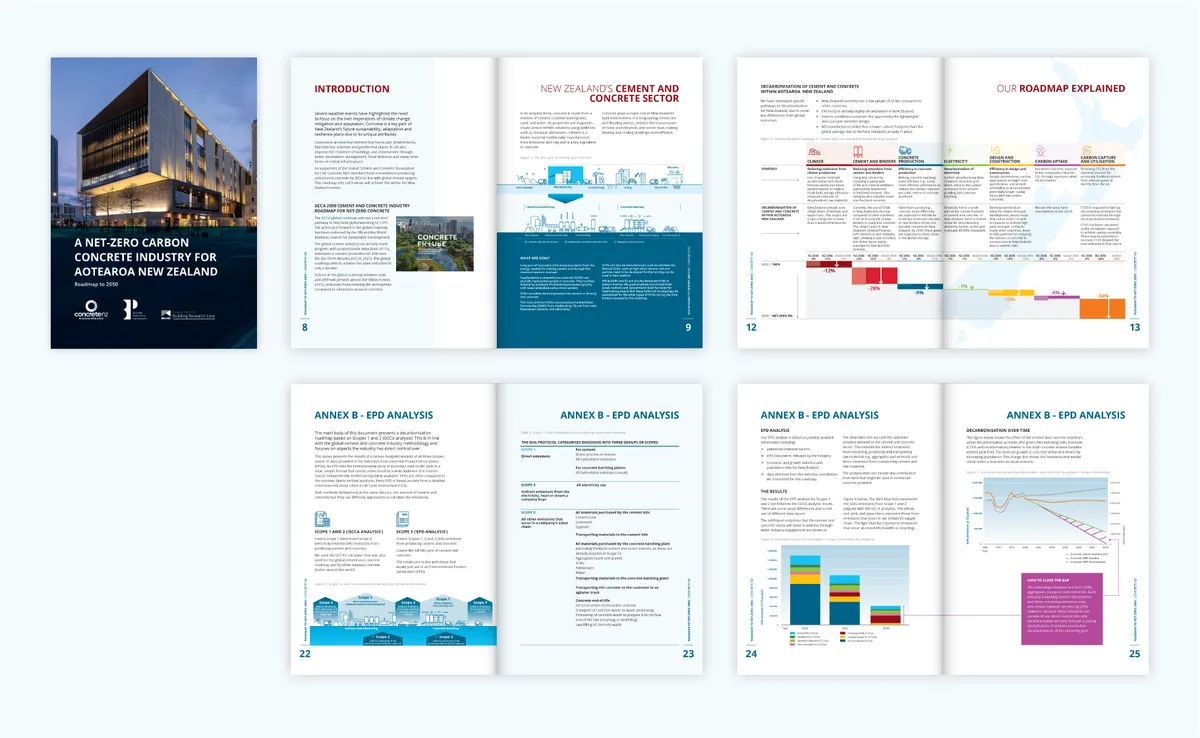
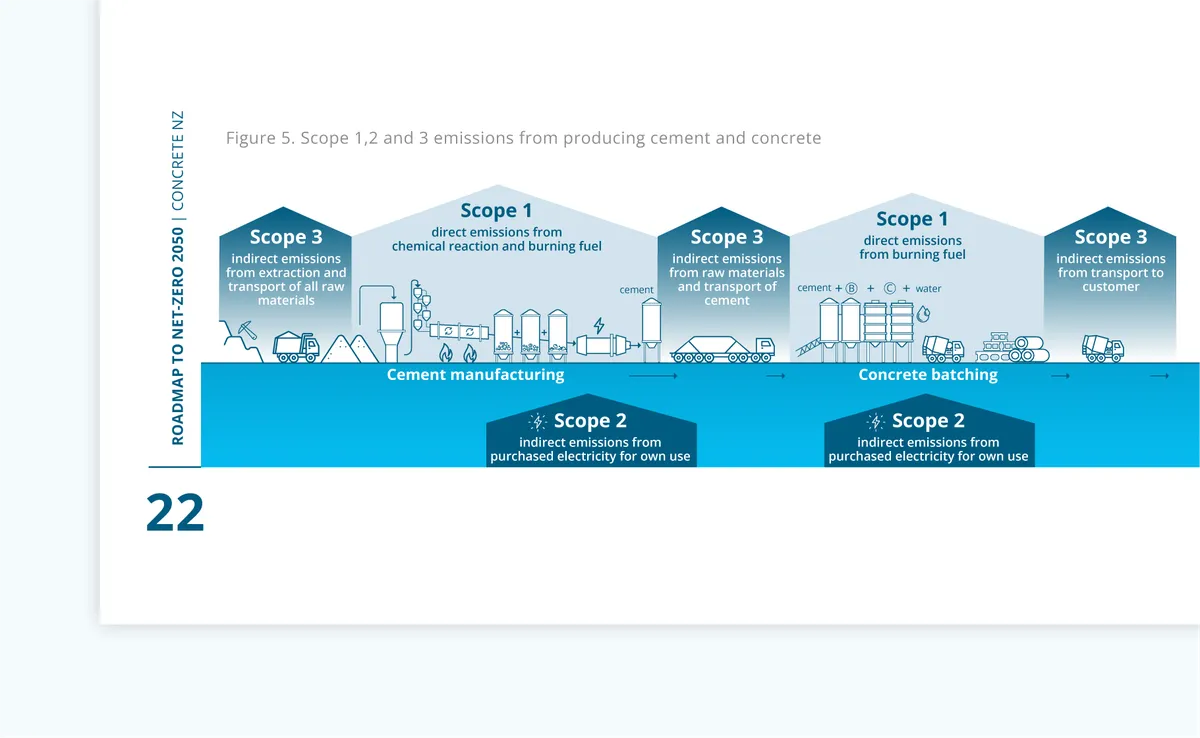
We worked together with Concrete NZ to develop a Roadmap to Net-Zero Carbon for Aotearoa New Zealand’s Concrete Industry. Infographics used in the report help explain where the industry emissions are coming from and how each reduction impacts the overall result.
Click here to view the report.
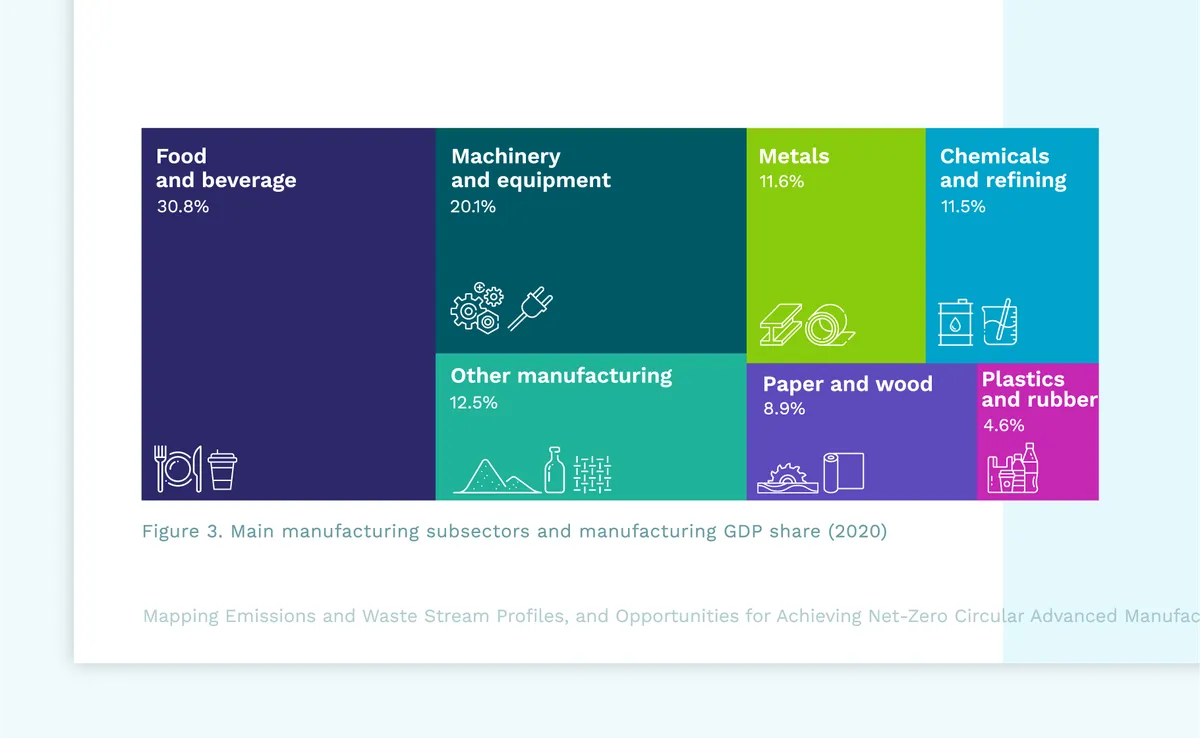
Sustainability report - MBIE
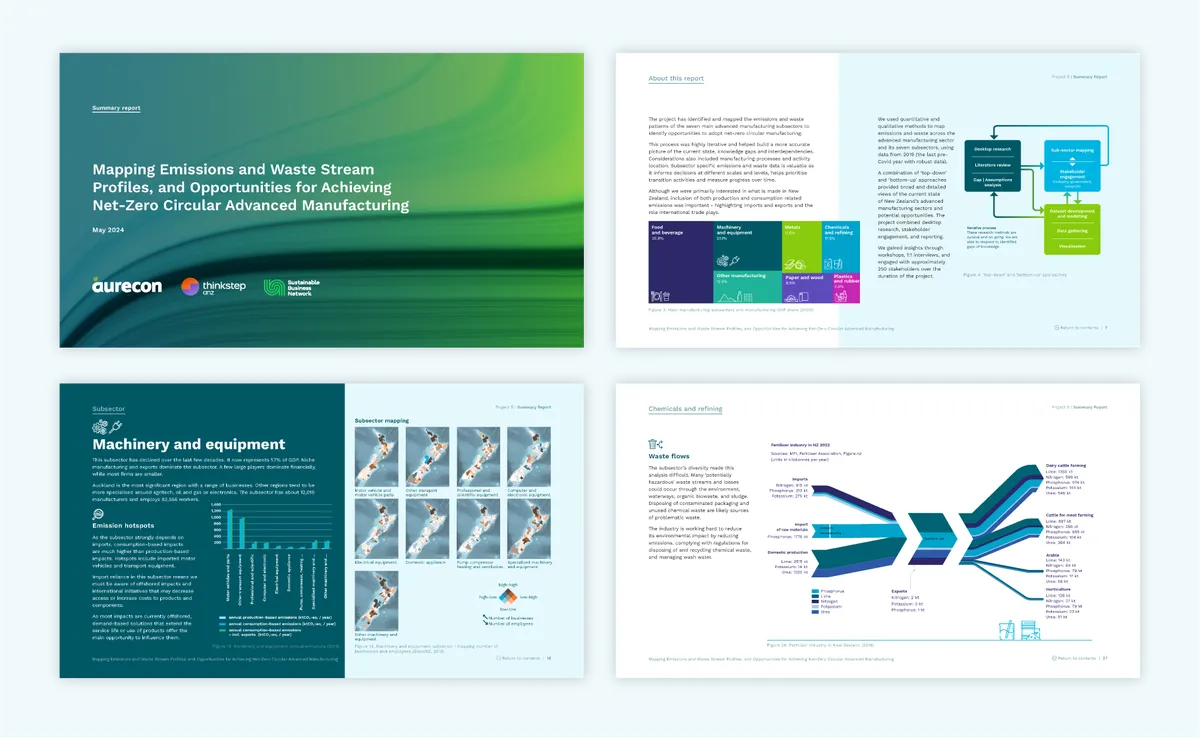
The report supports the growth and resilience of Aotearoa New Zealand’s advanced manufacturing sector. Diagrams and infographics help define the various inputs. The colour scheme also helps the reader move through the document in defined sections.
Click here to view the report.
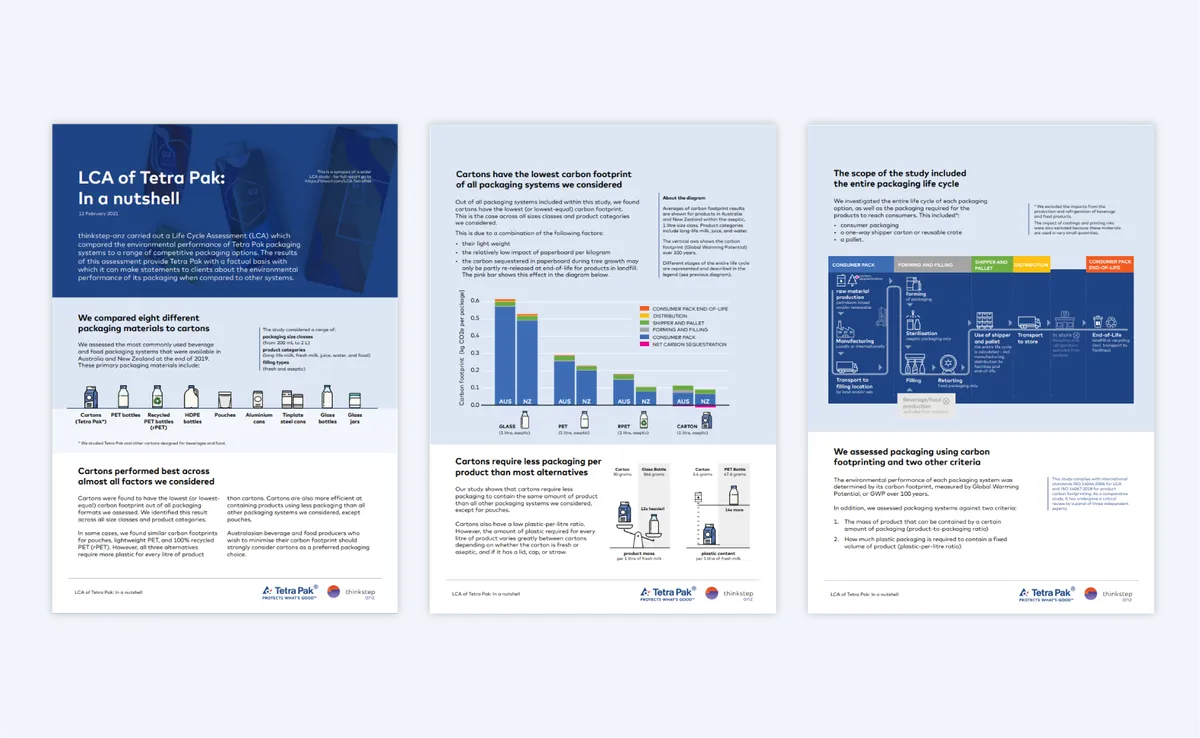
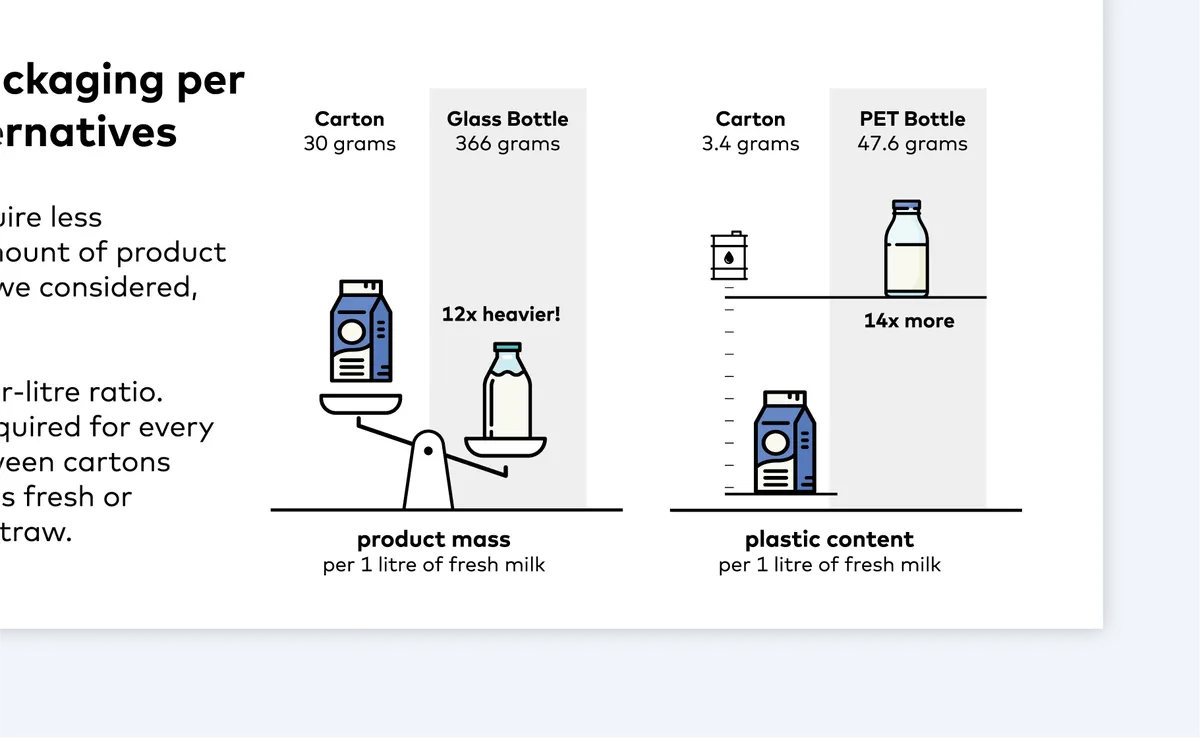
Nutshell report - TetraPak
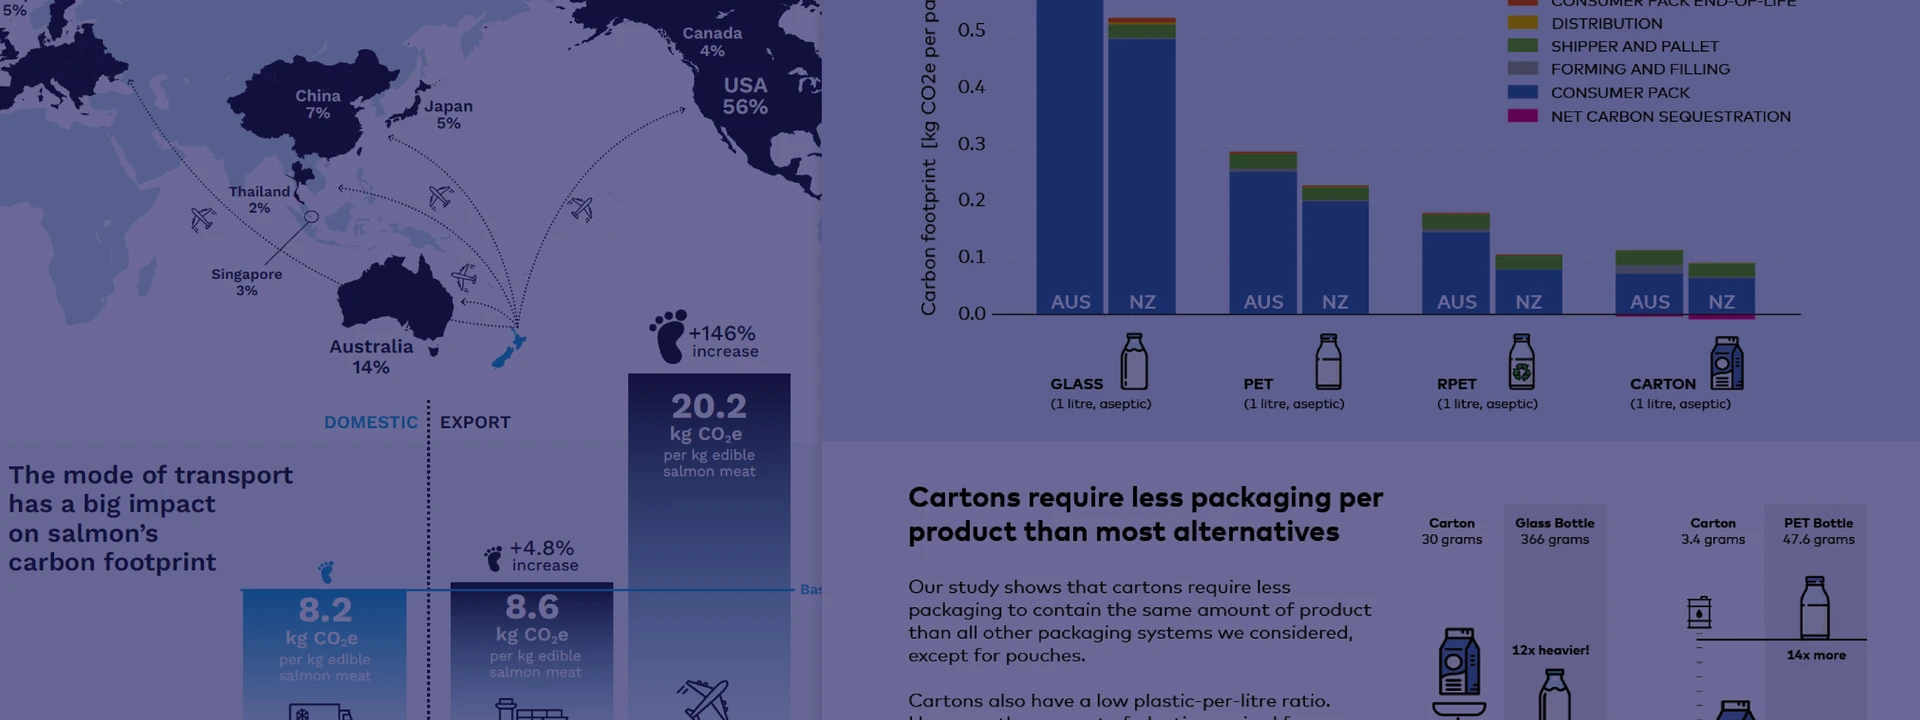
This nutshell (designed, short-form report) presents the findings of Tetra Pak’s packaging Life Cycle Assessment to the Australian manufacturer’s stakeholders, including customers, using clear, easy to read diagrams.
Click here to view our case study and the nutshell report.
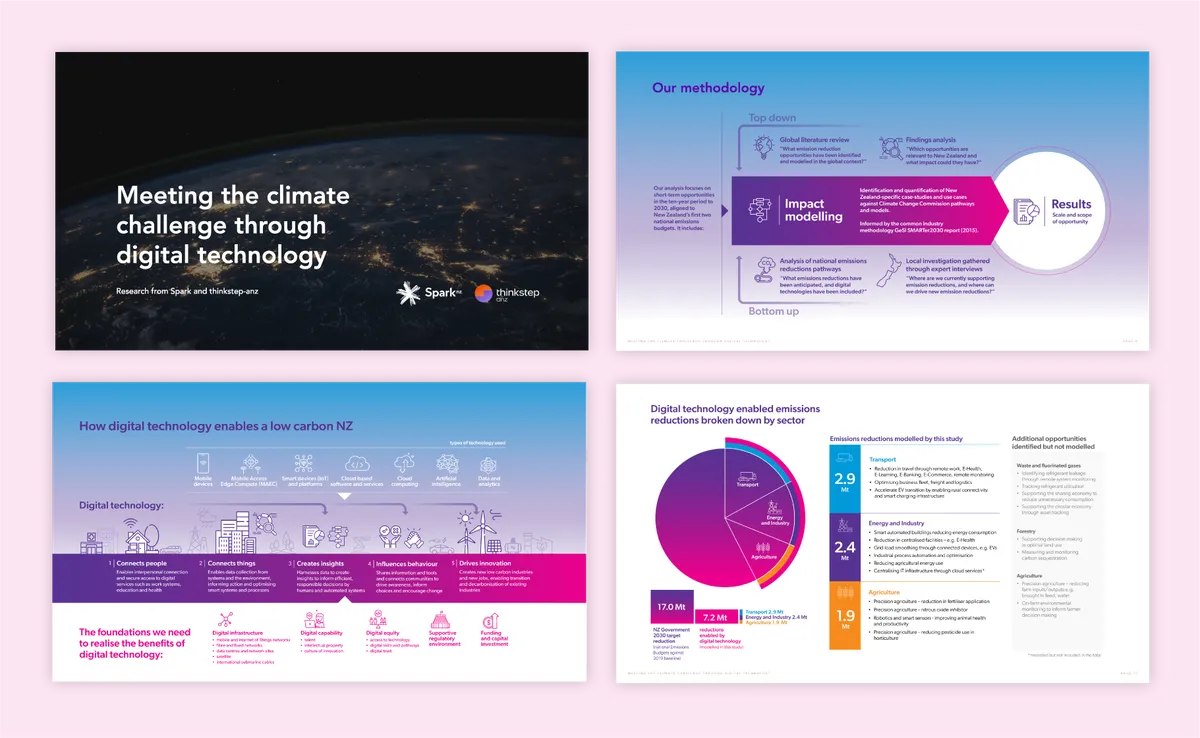
Research report - Spark NZ
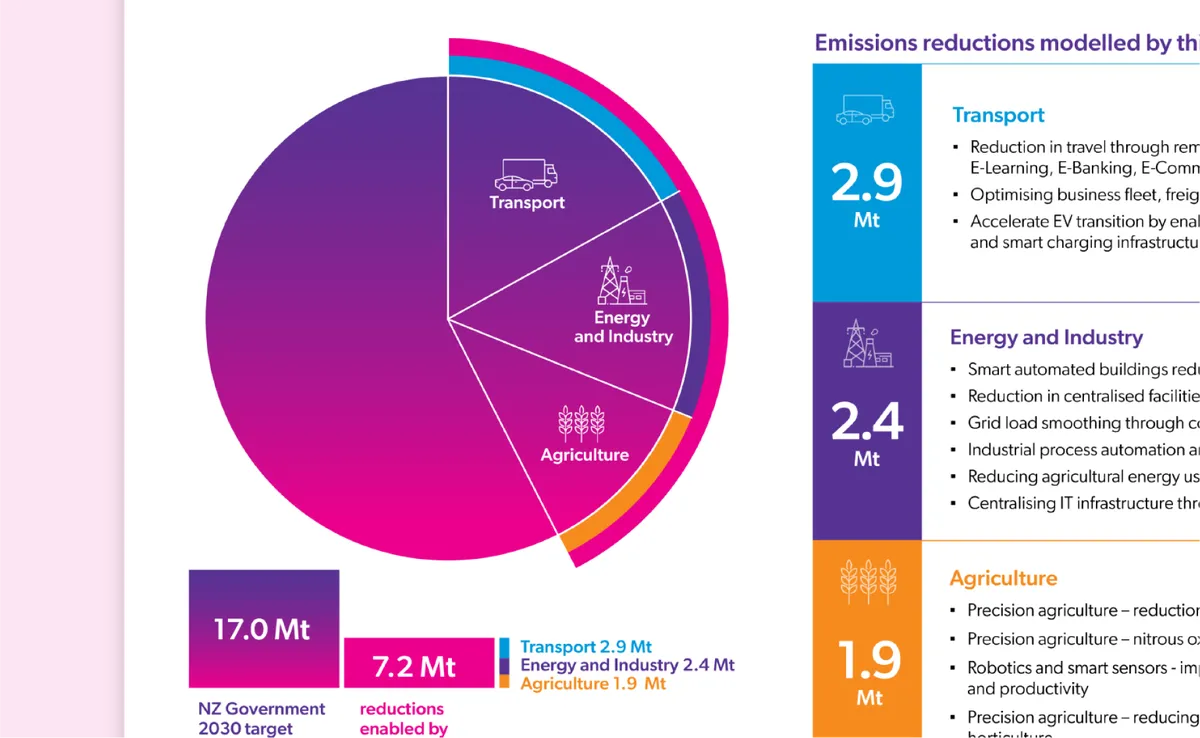
On this project with Spark we’ve used data to understand the sectors and solutions where digital technology offers the greatest potential to help decarbonise Aotearoa New Zealand. We’ve utilised to with clear writing and design to explain the results.
Click here to view the report.
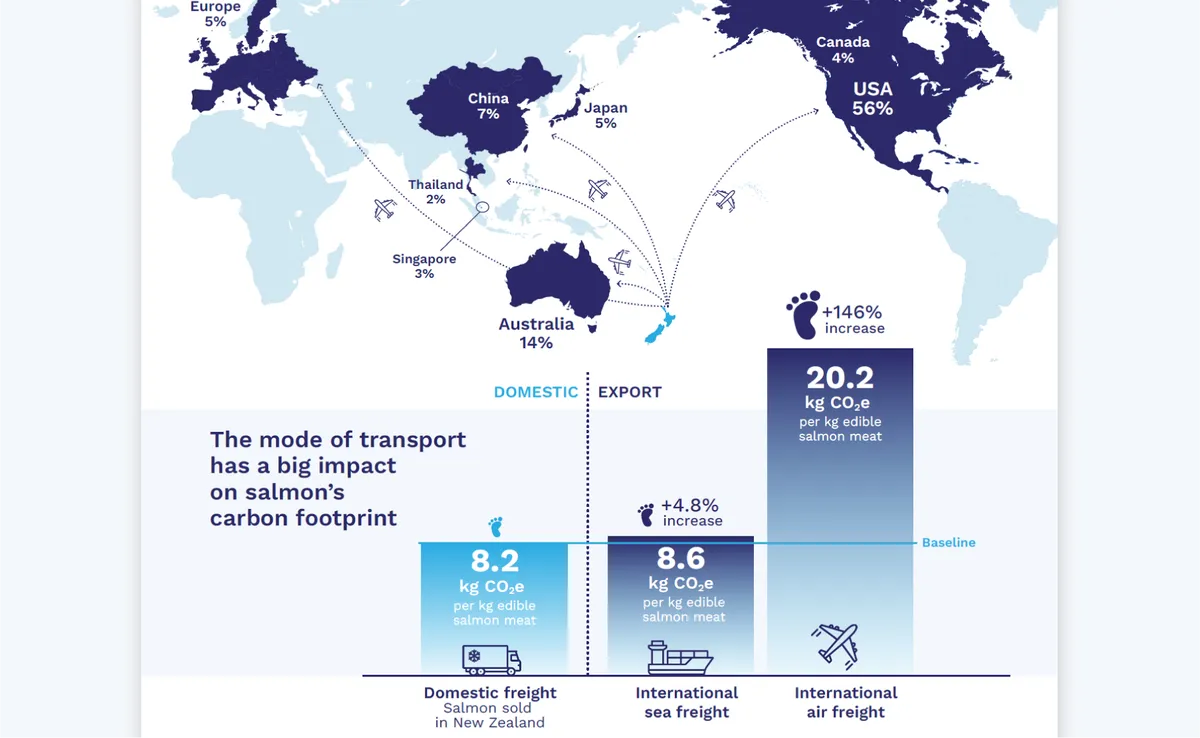
Nutshell report - NZ King Salmon
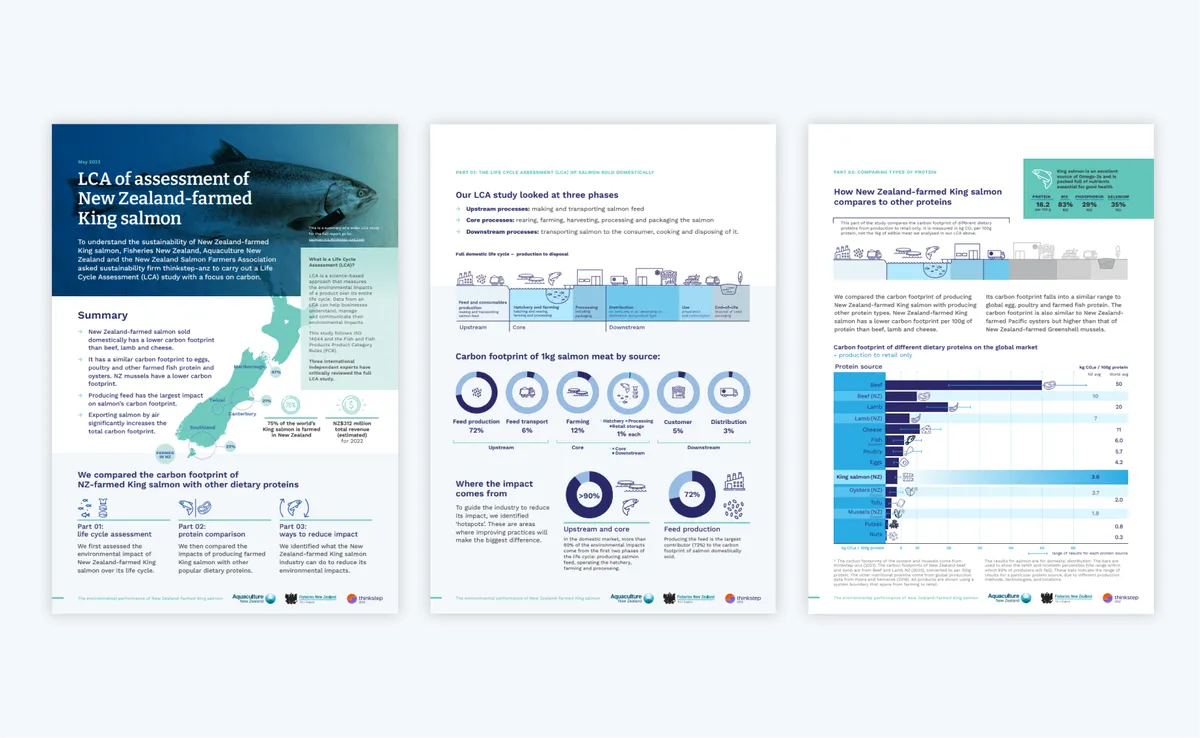
This report presents the findings of NZ Salmon’s LCA study to with clear writing and design. The infographic shows the impact of export.
Click here to view our case study and the nutshell report.
Emissions report - Oceania Healthcare
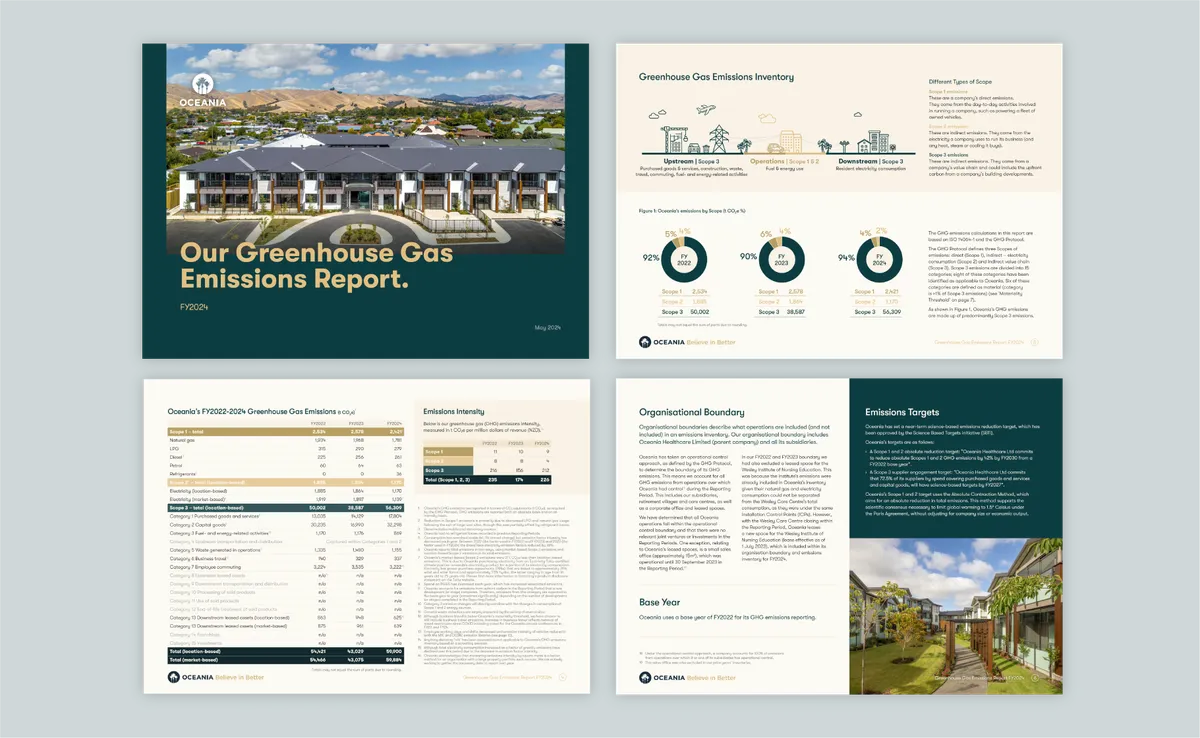
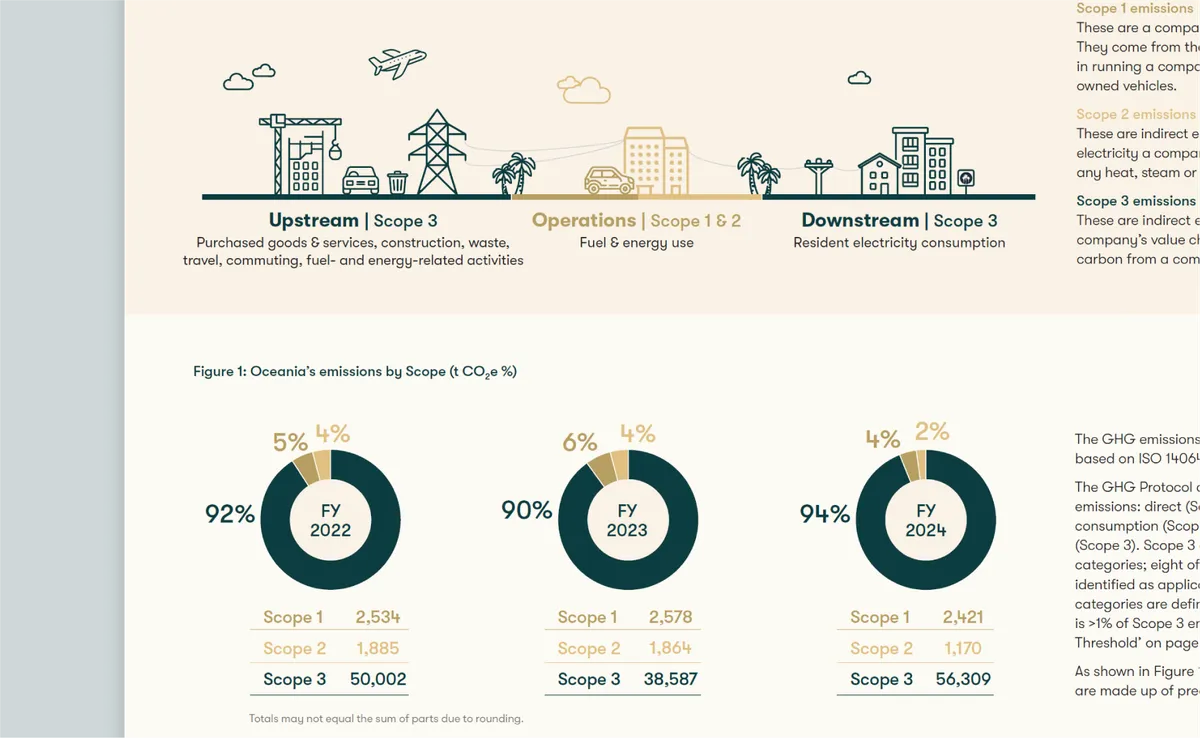
In this report, we helped Oceania to measure, report on, and communicate their commitment to minimising their greenhouse gas emissions across their operations and value chain. Designed graphics help tell the story.
The report is published on their website here (scroll down to Our Greenhouse Gas Emissions Performance.)
Designing for communication
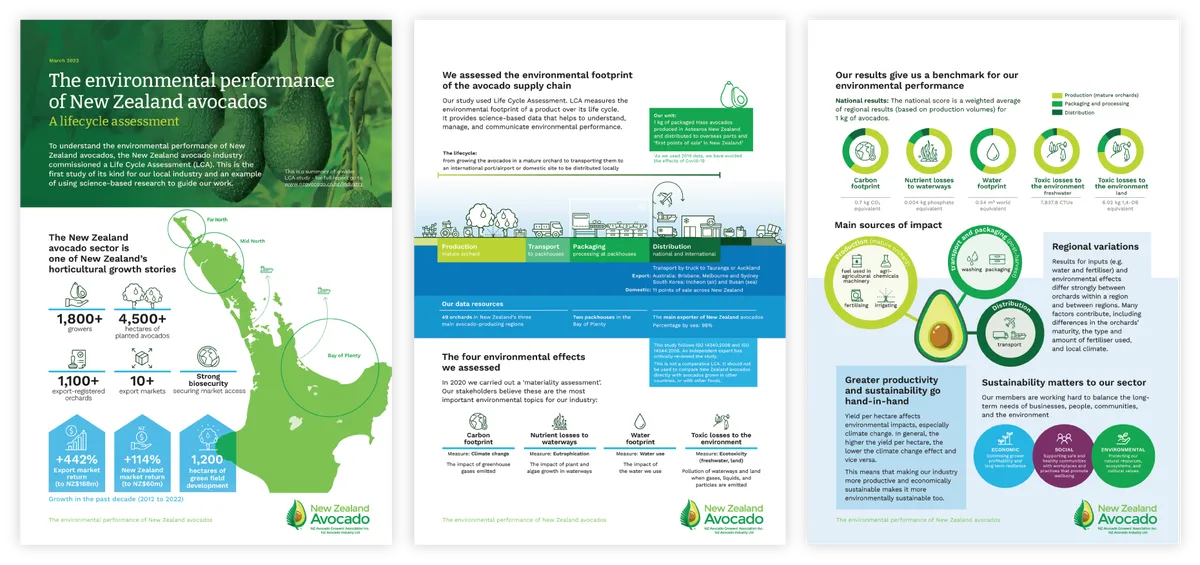
Design that uses diagrams, icons and images helps make communication simple and big data and concepts easy to understand. Check out more examples of how we use infographics in our Nutshell short-form reports.
Talk with our expert

Caroline Noordijk, our Head of Creative, leads our design team. She is an expert in design thinking and understands how good design can help organisations tell their sustainability story.
Caroline and her team use design to highlight what matters. They produce infographics, case studies, sustainability reports and Environmental Product Declarations (EPDs). They also work with our technical experts to help our clients understand and act on our technical reports.
Caroline is a creative with a strong business background. She has worked in product design, product development and brand identity with start-ups, SMEs, corporates, and government in New Zealand and Europe.